A journey into PostgreSQL logical replication - the next chapter
Last year, we embarked on a journey to leverage PostgreSQL logical replication to build a data change CDC pipeline fundamental to help us transform our transactional data in analytical data models tuned to serve specific analytic use-cases.
As the developed system matured we found new challenges in our push toward an event-driven architecture and OLAP powered features. We want to talk about these challenges, specifically the ones that we overcome by using PostgreSQL to - not only serve the OLAP data - but also to do the required transformations of the sourced data, in near real-time.
The next chapter
After we sorted our troubles managing PostgreSQL logical replication slot consumption state, our CDC of postgres events started to work reliably. We even used it a few times to debug data issues in situations where the transactional data was overwritten. And we found no data inconsistency since, and it was time to focus on what came next.
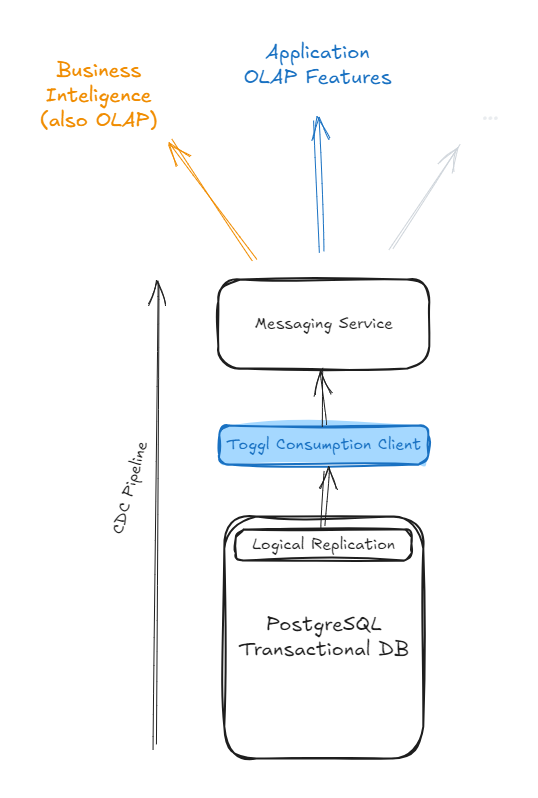
Today almost all our transactional databases have our logical replication client attached to them and are streaming data to our data-event layer, our CDC. The data sourced from our transactional databases is then used for the most varied ends. This data source segregation also proved useful to ensure system reliability.

And we started to develop analytic features on top of it. These go from generalist data aggregations - where we sum up time - to more complex reporting, evolving heavier data transformations. The ability to spin off new databases - OLAP or not - and keep them up-to-date with transactional data brought speed and independence to teams across our engineering department.
We also have been extending its applications for other purposes such as decreasing the lag of business intelligence tooling, for instance.
Data pipelines
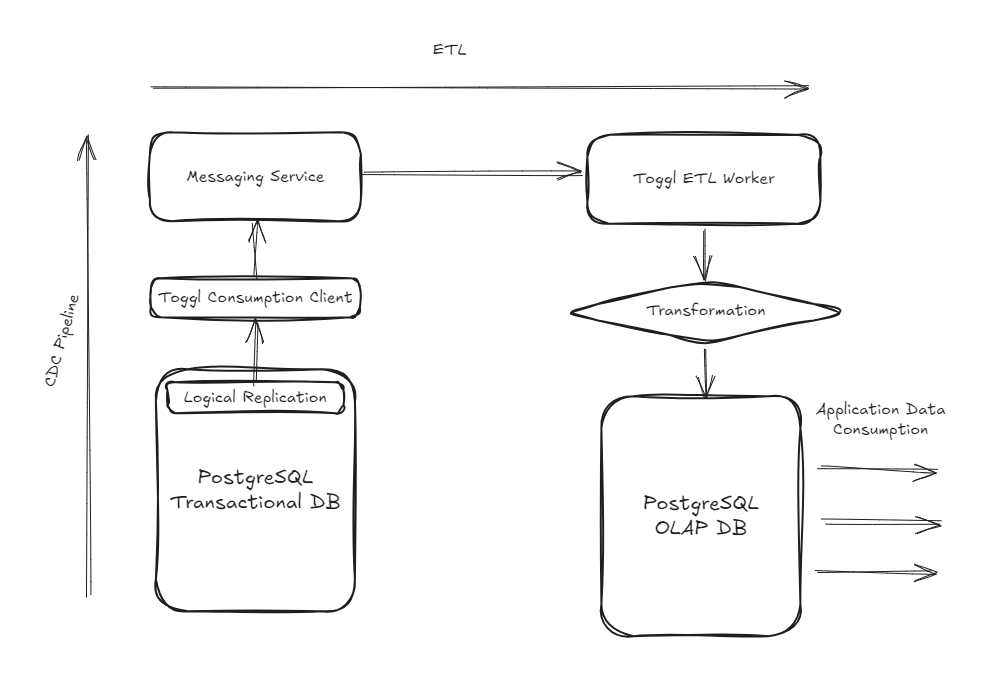
In practice, we create subscriptions in our messaging service behind the CDC pipeline, and with each new subscription, the service attached to it can keep the respective database in sync with our transactional databases, creating independent ETL pipelines. This allows us to advance the development of non-core parts of the system independently. But, of course, also brings challenges when things on our transactional database change.
When we started to develop our transformations, we wanted to move data from our monolith transaction database, but in parallel to that other efforts have been made to decouple domains from our main service. Such as subscriptions or authentication. And… a new authorization layer.

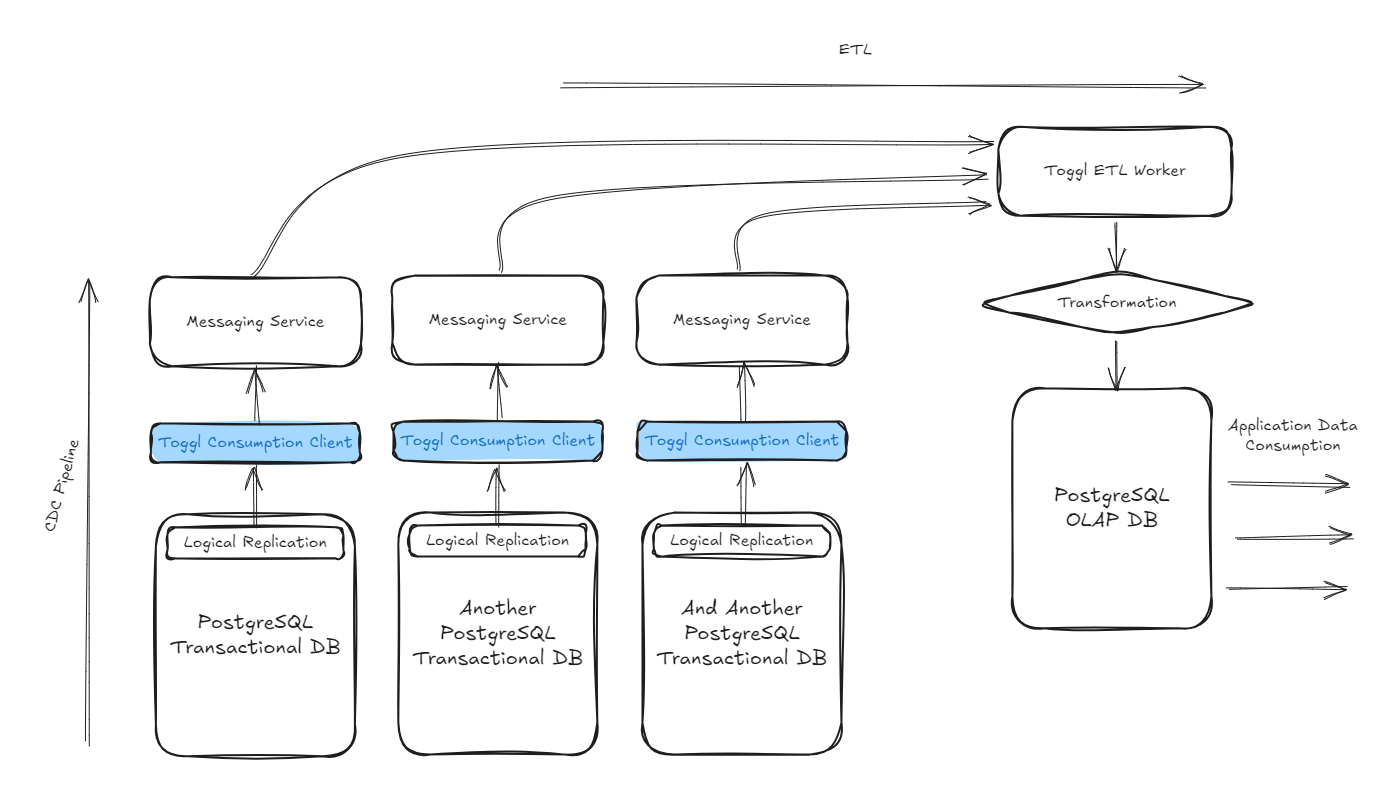
As a result, some new projects needed to tap into data sourced from different transactional databases. From different sources of truth. That drove the need to source data from the different databases into our CDC and resulting ETL pipelines. All data ends up traveling in the same data backbone and can be accessed, and managed by mostly reusing the same go package.

PostgreSQL logical replication was just the very beginning of the journey, each blue box represents a different deployment of our replication consumption client, listening to a different replication stream, from a different database, and making that data generally available in the CDC pipeline.
Authorization system
Our new authorization layer is a project using the CDC. That stands out unexpectedly but has more to it.
Toggl Track had a limited and hard-coded system of roles. It's more than that, but we can sum it up to whether you are an admin or not. Replacing the entire authorization layer was a major project, as most of these rules are enforced at the database layer. On top of that, we have been decoupling domains from our main service, which means that data to assess authorization rules was now coming from different sources of truth, such as the old monolithic database where entity settings are stored, our new subscription service, and the new authorization database where we were planning to store roles, permissions and their relations to users.
However, in addition to providing more role flexibility, we set out to deal with performance bottlenecks while resolving authorization rules for large organizations with tens of thousands of projects and users. Authorization alone was taking a considerable amount of response time for reporting features, for instance.
The solution that we came up with was computing a data object with all the needed information to solve authorization. But, as we didn't want to increase sign-in time, we needed to generate that object pre-session. While looking for ways to achieve this, our newly developed CDC pipeline couldn't have come at a better time.
This means that while projects are added to a workspace, the user sessions belonging to that workspace are being precomputed on our authorization OLAP database through the ETL process that is sourcing data available on the CDC from the different transactional databases.
Of course, you don't want to wait forever for your newly created project to be usable! These sessions have to be updated fast, near real-time. Doing these transformations fast, over a large and constant stream of data highlighted some... light DB tips.
Tips & Tricks
Handling duplication
While properly managing the state of our logical replication slot fully prevents data loss, there is still the possibility of data duplication, on plug-off events, for instance.
We embraced the duplication possibilities from the get-go, which turned out to be an advantage. Our CDC carries the LSN from the logical replication event that generated a given data event, and we use it as an identifier for simpler data aggregations, while for more complex ones we make use of updated timestamps to filter out unnecessary data changes, which prevents duplicated operations.
The updated_at is required in all our transactional tables, and its update is enforced through triggers.
Overall, the operations on our OLAP transformation end up atomic. Different data events resulting from the same transaction will become atomic in our data stream. And we strive for idempotence, either using the data identifier or the updated timestamps, processing the same event multiple times will need to generate the same result. Ideally processing events out of order should also produce the same result.
Bulk first
Large transactions can easily generate thousands of data events. Processing these events individually in OLAP would be challenging. Bulking their ingestion and processing was a key factor in dealing with large volumes of data in near real-time.
INSERT INTO transformation (
  user_id,
  total_time,
  updated_at
)
SELECT
  (d->>'user_id')::int AS user_id,
  (d->>'total_time')::int AS total_time,
  (d->>'updated_at')::timestamp without time zone AS updated_at
FROM JSON_ARRAY_ELEMENTS($1::jsonb) d
ON CONFLICT ON CONSTRAINT transformation_pkey
DO UPDATE SET
  total_time = excluded.total_time,
  updated_at = excluded.updated_at
WHERE
  transformation.updated_at <
    excluded.updated_at;
Data ingestion will vary from transformation to transformation, but if we were to draw a baseline, it would look like this.
We feed to postgres a single parameter, which is a json array string. We then use json array functions from postgres to turn that data into table records, and we always try to insert them first. Then, we make use of conflict constraints to decide if we should update the existing data or skip it.
The where clause in the query above is an application example of the updated_at fields that we talked about above.
Dealing with low-level data models
Our data events on the CDC pipeline contain only the information of the affected table row. The data event schema matches the table definition at the time that it was generated.
This low-level data structure is most of the time incomplete for what we need to do. Sometimes we need data from other tables, or relation keys that only exist in the parent entity, this is normal as our source is normalized transactional data.
We found that the optimal way to deal with missing data on individual data events is to keep a small version of the entities, that we need to relate to our OLAP database. It's something like a cache, updated by the ETL process itself. And through triggers, we use these updates to populate our final OLAP model.
Statement triggers
Similarly to defaulting to bulking, we should be aware of what kind of triggers we define. If we define row-level triggers, the transformation query will run once for each row changed by our data update, while if we use statement triggers, we execute it only once.
Of course, this will also imply supporting it in the trigger function.
CREATE TRIGGER after_update AFTER UPDATE ON transformation
  REFERENCING NEW TABLE AS new_table OLD TABLE AS old_table
  FOR EACH STATEMENT EXECUTE FUNCTION olap.update_team_goals();

CREATE OR REPLACE FUNCTION olap.update_team_goals() RETURNS trigger LANGUAGE plpgsql AS $$
  BEGIN
    WITH changes AS (
 SELECT t.team_id, SUM(new_table.total_time - COALESCE(old_table.total_time, 0)) AS total_time
 FROM relations.user_teams t
 JOIN new_table ON t.user_id = new_table.user_id
 LEFT JOIN old_table ON new_table.user_id = old_table.user_id
 GROUP BY t.team_id
    )
    UPDATE olap.team_goals tg SET total_time = total_time + changes.total_time
    FROM changes WHERE tg.team_id = changes.team_id;


    RETURN NULL;
  END;
$$;
In the code above you can find a practical example of the process. We define a trigger over a transformation table, calling the olap.update_team_goals function, referencing new and old data tables. This call is for EACH STATEMENT.
If we look at the function, these reference tables have only the user_id and total_time, however, as the function name states, we want to update the team goals. As so, we must find out the team_id for the teams to which each user belongs, and that's done in the CTE by cross-checking the new data table with the relations.user_teams existing on our OLAP database and kept up to date by the ETL pipeline.
We join it with the new and old tables - as we want to find the time difference added by the new change - and we use the results to update our final transformation in the update query below.
Inclusive Indexes
In this way, we end up using smaller versions of the transactional entity on our OLAP database, and because of that many of our table searches are for a limited amount of data. By making use of inclusive indexes, we can save a trip to the table, at run time, to retrieve the bit of information that we are looking for because it will be part of the index.
This can cut execution time in half very easily.
CREATE SCHEMA relations;
CREATE TABLE relations.user_teams (
  user_id integer NOT NULL,
 team_id integer NOT NULL,
  CONSTRAINT user_teams_pkey PRIMARY KEY (user_id, team_id)
);

INSERT INTO relations.user_teams (user_id, team_id)
SELECT (random() * 10000)::int AS user_id, (random() * 1000)::int AS team_id
FROM generate_series(1, 1000000)
GROUP BY 1, 2;

SELECT user_id, COUNT(1) FROM relations.user_teams GROUP BY user_id ORDER BY 2 DESC LIMIT 1;

CREATE INDEX simple_user_index ON relations.user_teams (user_id);
EXPLAIN (ANALYSE, VERBOSE) SELECT team_id FROM relations.user_teams WHERE user_id = 1560;

CREATE INDEX inclusive_user_index ON relations.user_teams (user_id) INCLUDE (team_id);
EXPLAIN (ANALYSE, VERBOSE) SELECT team_id FROM relations.user_teams WHERE user_id = 1560;
In the runnable sample above we create our acquainted relations.user_teams table, with a user_id and a team_id columns, making them our composite primary key. We then generate some sample data, and we search for the user with the most teams - to get the most meaningful results.
We create a simple index over our user_id, our search condition. Run an explain, and create an inclusive index, where we include the team_id. Note that team_id is not searchable and will not be used as an index condition, but it's usable as part of the index search.
Looking at the results:
Index Scan using simple_user_index on relations.user_teams  (cost=0.42..4.29 rows=95 width=4) (actual time=12.193..12.220 rows=128 loops=1)
  Output: team_id
  Index Cond: (user_teams.user_id = 1560)
Planning Time: 0.116 ms
Execution Time: 12.253 ms
In the first explain, we see our simple index being applied. However, in the second:
Index Only Scan using inclusive_user_index on relations.user_teams  (cost=0.42..3.19 rows=95 width=4) (actual time=0.077..0.089 rows=128 loops=1)
  Output: team_id
  Index Cond: (user_teams.user_id = 1560)
  Heap Fetches: 0
Planning Time: 0.129 ms
Execution Time: 0.112 ms
We end up with an execution time of about 1/10th of the original time. We have "Heap Fetches: 0", which means, we never used the table data to fetch results from.
Generated columns
Another trick has to do with unstructured data on source transactional databases. We can find ourselves in need of retrieving data from a JSON structure to build our transformation on. That data may be easily accessible through the application layer, but in OLAP may be challenging to access due to the atomicity of the sourced data events.
If we create generated columns from such data, sure, it will take a little longer to write operations, but we can index it. This is especially important if we are not searching for a specific value within the JSON field where GIN indexes are useful.
CREATE SCHEMA olap;
CREATE TABLE olap.unstructured (
 dump jsonb NOT NULL
);

INSERT INTO olap.unstructured (dump)
SELECT JSONB_BUILD_OBJECT('user_id', (random() * 10000)::int, 'total_time', (random() * 1000)::int, 'goal', (random() * 1000)::int + 1) FROM generate_series(1, 100000000);

CREATE INDEX unstructured_gin_index ON olap.unstructured USING GIN (dump);

EXPLAIN (ANALYSE, VERBOSE) SELECT COUNT(1) FROM olap.unstructured
WHERE (dump->>'total_time')::int >= (dump->>'goal')::int;

ALTER TABLE olap.unstructured ADD COLUMN goal_completed boolean
GENERATED ALWAYS AS ((dump->>'total_time')::int >= (dump->>'goal')::int) STORED;
CREATE INDEX goal_completed_index ON olap.unstructured (goal_completed);

EXPLAIN (ANALYSE, VERBOSE) SELECT COUNT(1) FROM olap.unstructured WHERE goal_completed;
This time we create an olap.unstructured table with a single JSON field (don't do this in real life). We then generate some sample data, basically JSON objects with 3 fields: random user IDs, total times, and goals.
We create a GIN index, which we will see that it's useless for our case, and then run an explain on a query that is counting the number of users that fulfilled their goal. After that, we create a generated column with that same condition and index it.
EXPLAIN (ANALYSE, VERBOSE) SELECT COUNT(1) FROM olap.unstructured
WHERE (dump->>'total_time')::int >= (dump->>'goal')::int;
—--------------------------------------------------------------------------------------------------
Finalize Aggregate  (cost=2292731.42..2292731.43 rows=1 width=8) (actual time=74036.280..74047.599 rows=1 loops=1)
  Output: count(1)
  ->  Gather  (cost=2292731.00..2292731.41 rows=4 width=8) (actual time=74036.072..74047.584 rows=5 loops=1)
        Output: (PARTIAL count(1))...
        ->  Partial Aggregate  (cost=2291731.00..2291731.01 rows=1 width=8) (actual time=74029.976..74029.977 rows=1 loops=5)
              Output: PARTIAL count(1)...
              ->  Parallel Seq Scan on olap.unstructured  (cost=0.00..2270481.00 rows=8500000 width=0) (actual time=0.477..73068.822 rows=10190650 loops=5)
                    Filter: (((unstructured.dump ->> 'total_time'::text))::integer >= ((unstructured.dump ->> 'goal'::text))::integer)
                    Rows Removed by Filter: 10209350...
Planning Time: 10.810 ms
Execution Time: 74048.038 ms
Looking at the query plan for the first query we see that we actually end up with a sequential scan, and quite a bit of execution time. This happens because in this case, we are not searching for a specific value within the json object, where GIN indexes would help. Instead, that index is not used here because we are comparing properties within the json object itself.
EXPLAIN (ANALYSE, VERBOSE) SELECT COUNT(1) FROM olap.unstructured WHERE goal_completed;
—--------------------------------------------------------------------------------------------------
Finalize Aggregate  (cost=692971.65..692971.66 rows=1 width=8) (actual time=3173.567..3195.634 rows=1 loops=1)
  Output: count(1)
  ->  Gather  (cost=692971.23..692971.64 rows=4 width=8) (actual time=3173.488..3195.625 rows=5 loops=1)
        Output: (PARTIAL count(1))...
        ->  Partial Aggregate  (cost=691971.23..691971.24 rows=1 width=8) (actual time=3165.396..3165.397 rows=1 loops=5)
              Output: PARTIAL count(1)...
              ->  Parallel Index Only Scan using goal_completed_index on olap.unstructured  (cost=0.57..660276.85 rows=12677752 width=0) (actual time=0.161..2484.704 rows=10190650 loops=5)
                    Output: goal_completed
                    Index Cond: (unstructured.goal_completed = true)
                    Heap Fetches: 0...
Planning Time: 0.234 ms
Execution Time: 3195.690 ms
Our second query shows a considerable improvement in execution time because it makes use of the index, created over the generated field.
Bonus: Note that there are 0 heap fetches. We are using COUNT(1), and because our operation doesn't need any more data, it can use the index alone. If we were to push execution to go back to the table, such as by using COUNT(*) that wouldn't be the case; that would degrade response time.
JSONB
On our authorization transformation, we were looking to generate a session object in JSON. That meant that more than transversing the data model, this ETL transformation was about aggregating data, in particular, aggregating data hierarchically in JSON format.
We have large organizations with tens of thousands of projects, for our transformation that means generating and aggregating tens of thousands of small JSON objects. Aware of the advantages of using JSONB for storage, we didn't think twice about executing our smaller operations using JSONB functions, which meant many small parsing operations on every iteration degrading session update response time.
If, instead, we cast the result, we convert it only once, resulting in a sweat performance improvement.
EXPLAIN (ANALYSE, VERBOSE) SELECT JSONB_BUILD_OBJECT('obj', obj) FROM (
 SELECT JSONB_OBJECT_AGG(user_id, tracked_obj) AS obj FROM (
  SELECT user_id, JSONB_OBJECT_AGG(team_id,  JSONB_BUILD_OBJECT('total_time', (random() * 1000)::int)) AS tracked_obj FROM (
   SELECT (random() * 10000)::int AS user_id, (random() * 10000)::int AS team_id
   FROM generate_series(1, 1000000)
  ) gen
  GROUP BY user_id
 ) agg
) foo;
—--------------------------------------------------------------------------------------------------
Subquery Scan on foo  (cost=50005.01..50005.03 rows=1 width=32) (actual time=6325.727..6368.489 rows=1 loops=1)
  Output: jsonb_build_object('obj', foo.obj)
  ->  Aggregate  (cost=50005.01..50005.02 rows=1 width=32) (actual time=5503.496..5503.499 rows=1 loops=1)
        Output: jsonb_object_agg((..., (jsonb_object_agg(..., jsonb_build_object('total_time',...)
        ->  HashAggregate  (... (actual time=3535.802..4119.971 rows=10001 loops=1)...
Planning Time: 0.174 ms
Execution Time: 6412.477 ms
Postgres is doing exactly what we told it to do, using jsonb object aggregate methods. If instead:
EXPLAIN (ANALYSE, VERBOSE) SELECT JSONB_BUILD_OBJECT('obj', obj) FROM (
 SELECT JSON_OBJECT_AGG(user_id, tracked_obj) AS obj FROM (
  SELECT user_id, JSON_OBJECT_AGG(team_id, JSON_BUILD_OBJECT('total_time', (random() * 1000)::int)) AS tracked_obj FROM (
   SELECT (random() * 10000)::int AS user_id, (random() * 10000)::int AS team_id
   FROM generate_series(1, 1000000)
  ) gen
  GROUP BY user_id
 ) agg
) foo;
—--------------------------------------------------------------------------------------------------
Subquery Scan on foo  (cost=50005.01..50005.03 rows=1 width=32) (actual time=3295.757..3345.740 rows=1 loops=1)
  Output: jsonb_build_object('obj', foo.obj)
  ->  Aggregate  (cost=50005.01..50005.02 rows=1 width=32) (actual time=1846.187..1846.190 rows=1 loops=1)
        Output: json_object_agg((..., (json_object_agg(..., json_build_object('total_time',...)
        ->  HashAggregate  (... (actual time=1765.143..1776.300 rows=10001 loops=1)...
Planning Time: 0.104 ms
Execution Time: 3355.383 ms
We run a single parsing operation at the end of it. Improving execution time and resource usage.
Conclusion
This is how far we got in our journey leveraging postgres logical replication, and we have no plans to stop building on top of it. Leveraging this technology opens development avenues otherwise more difficult to pursue. We hope that our mistakes and discoveries can help you achieve great things too.
This post is based on the content of our A journey into PostgreSQL logical replication: the next chapter session, presented at PGConf.NYC 2024 earlier this month.